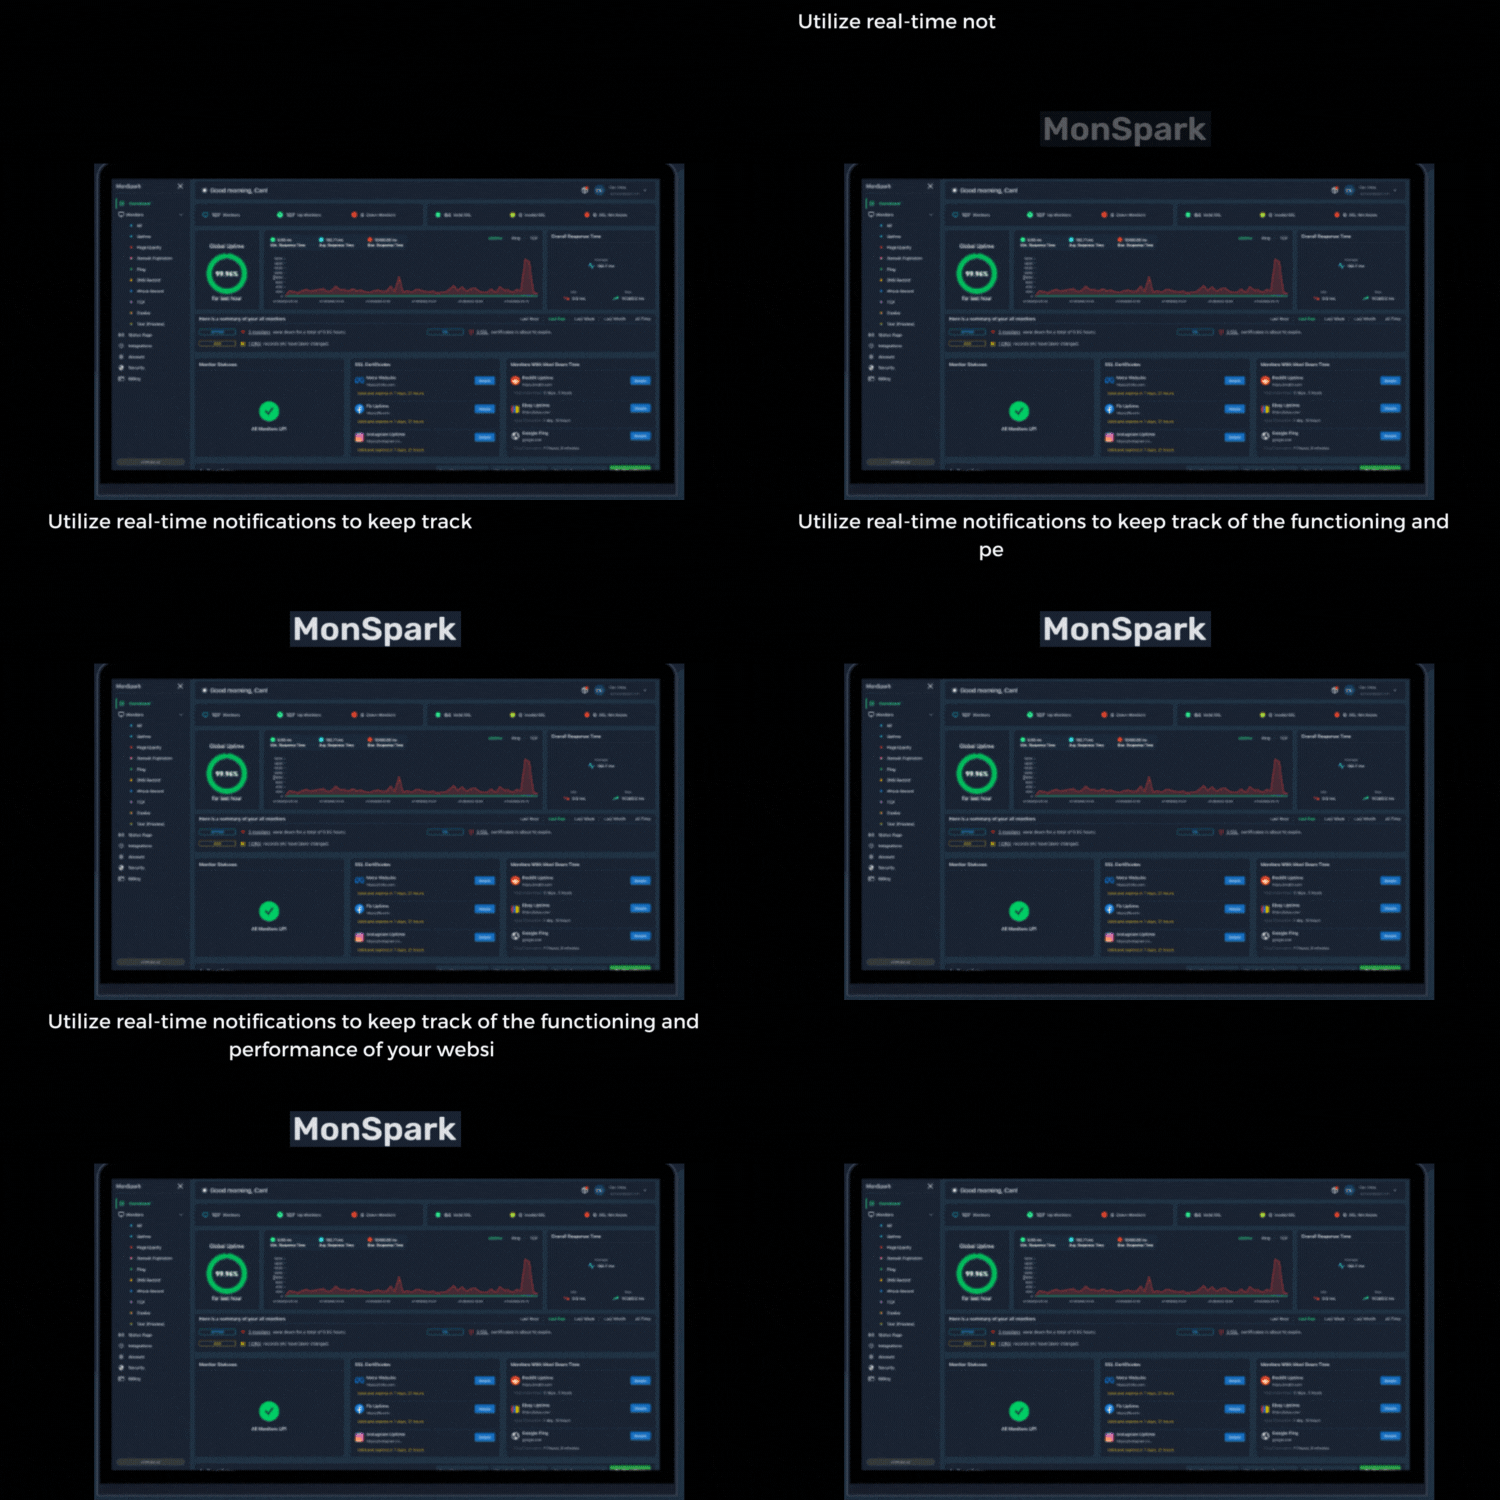
Website performance monitoring can sometimes seem like a full-time job. The issue with website, server and app downtime or crashes is that it’s frequently too late to take corrective action. Therefore, you must be aware of your service problems so that you can address them quickly and let your clients know about any maintenance updates. Imagine having a solution that could continuously monitor your servers, apps, and website in order to provide timely performance updates to all of your stakeholders. And the name of that wonderful tool is MonSpark. Over 85 countries utilize it as a web application monitoring service. You can use this tool to keep an eye on the functionality, usability, and even consistency of your web servers and applications. If something goes wrong, MonSpark immediately emails, SMSs, or even calls you. Additionally, MonSpark supports channels from outside services like MS Teams, Discord, and Slack.
![]()
![]()
![]()
![]()
![]()
What Is MonSpark?
Use the web application monitoring tool MonSpark to keep tabs on the operation, uptime, and content changes of your website and mobile application. No programming or complex setup is required to use MonSpark. As a result, you can easily monitor any website, server, or application through it.
Custom Update
By providing the target URL, a custom uptime check may be created in a matter of clicks. Give the custom uptime check a name, and then decide how frequently you want it to run.
Select the Notification Option
When your website goes down, you can choose to get notified via email, SMS, messaging applications, custom webhooks, or Zapier connections. As soon as MonSpark notices any changes, you will be notified via your preferred channel. As a result, you will be able to solve the problem immediately.
Development of an Uptime Monitor of MonSpark
There are many different monitoring tools available. However, the complexity of their items is the fundamental issue. These solutions are like a gigantic command center, even if all you want to do is check your website’s uptime status. Nobody wants to use multiple products and spend more because there are many different products for problems that are identical. MonSpark offers a ton of functionality in a straightforward dashboard because of this. To receive notifications when your website, app, or server goes down, create customized uptime monitors. MonSpark allows you to keep track of specific modifications made to web pages, such as those made to the text, images, and even supporting files like source code and cookies. In this method, you’ll be made aware of any price reductions, URL changes, or technological modifications to websites. Additionally, you may review your website’s SEO and loading times and get ideas for improvements. Additionally, you’ll receive notifications when crucial events occur on your website, such as changes to DNS records, expiring SSL certificates, and content modifications.
Text Viewer
Create watchlists to keep track of changes to specific content on your website or application. So that you may keep channels of communication open and prevent misunderstandings, MonSpark makes it simple to alert your customers about mishaps, outages, or status changes. Editable status pages can be hosted on your domain without the requirement for installation or additional code. In addition to external status pages for clients, you may also share password-protected status pages within your team.
Page of Status
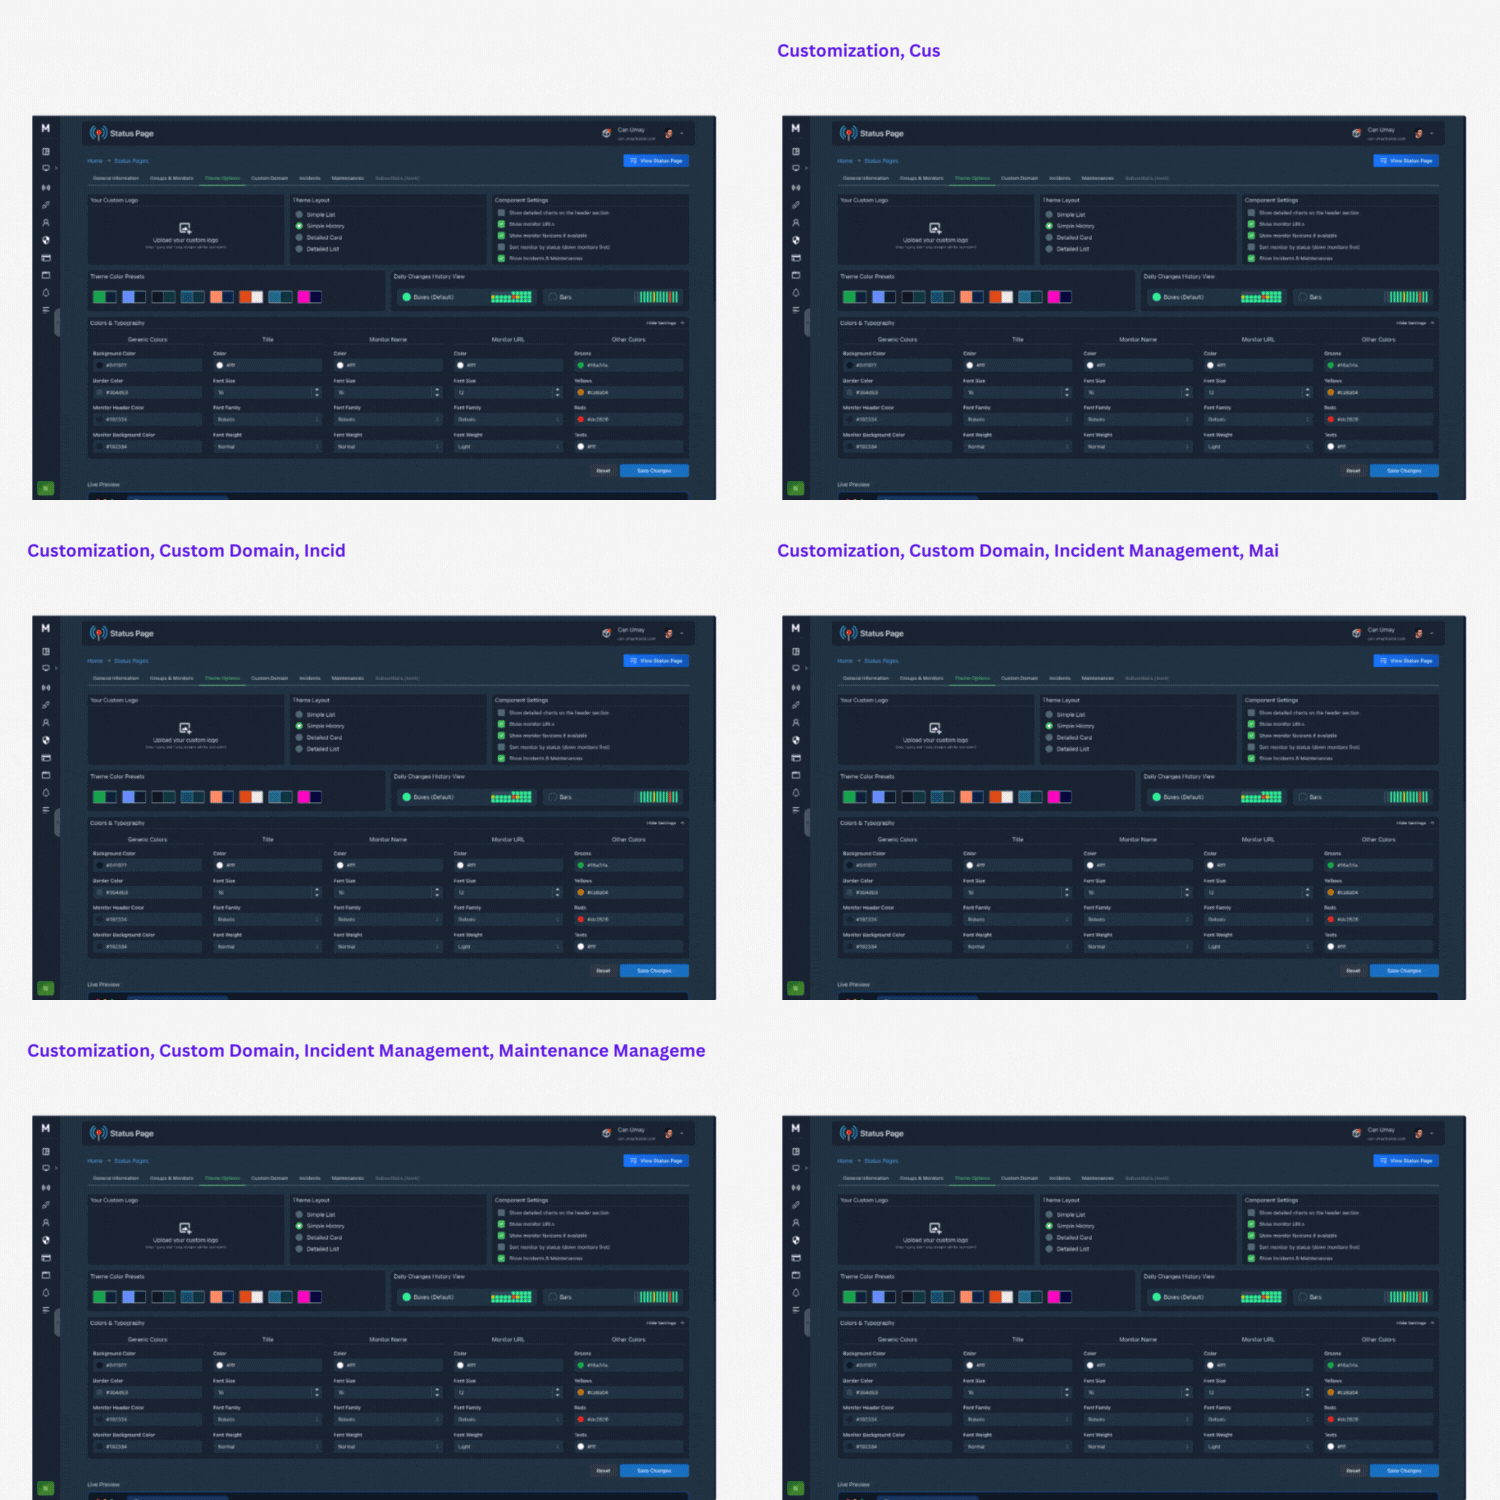
One of the best methods to gain your consumers’ trust is through a status page. With MonSpark, creating your status page only requires a few mouse clicks. The status pages on MonSpark include;
- Customization
- Custom Domain
- Incident Management
- Maintenance Management
You may send status updates in a flash by sharing bespoke status pages. For quick response to any potential issues, check the monitors’ real-time status. On the main dashboard, you can see the statistics and highlights for each of your monitors, which will streamline your productivity. Your event history can also be sorted by date, incident type, and downtime, and you can view reaction timings.
Dashboard for MonSpark
A dashboard is, at its most basic level, a panel in your program that shows information. A dashboard typically gives the user access to the most crucial information, features, and controls while also giving them a broad overview. In practice, a dashboard frequently turns into a kind of homepage, particularly for power users. Your website could fall down at any time if you don’t have an effective monitoring tool. As soon as your server, application, or website goes down, MonSpark notifies you so you can address the problem before it becomes worse. 60-day money-back guarantee. Try it out for two months to determine if it’s right for you.
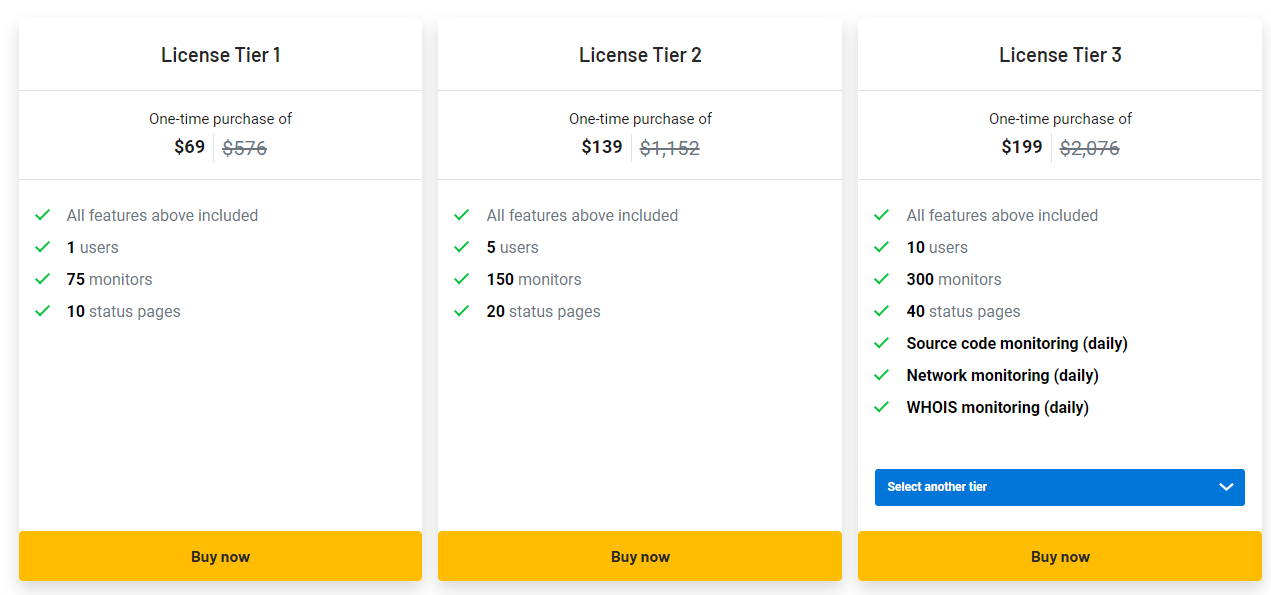
One-time purchase of $69 | $576
- 1 user
- 10 status pages across 75 monitors
- Log retention of one year
- Monitoring of progress
- Monitoring pings
- TCP tracking
- DNS record surveillance
- Screenshot surveillance (every 12 hours)
- Monitoring texts
- Enhanced request capabilities
- Personalized DNS SSL monitoring
- Lighthouse observation
- URL Watching
- monitoring of domain expiration
- An independent status pages
- Multi-location Surveillance
- Countless integrations
GET THIS LIFETIME DEAL
How Do New Clients Receive an Additional $10 Off?
- Go to the discount page for “MonSpark Lifetime Appsumo.”
- An offer popup will emerge if you wait just a little while.
- Enter to receive special deals.
- Sending emails to recipients from the same address.
- An additional $10 off is available.
- The promotion is only open to new clients.
If you are interested in other Appsumo products, you may visit TeliportMe Virtual Tours


Leave a Reply